 Monmore dogs
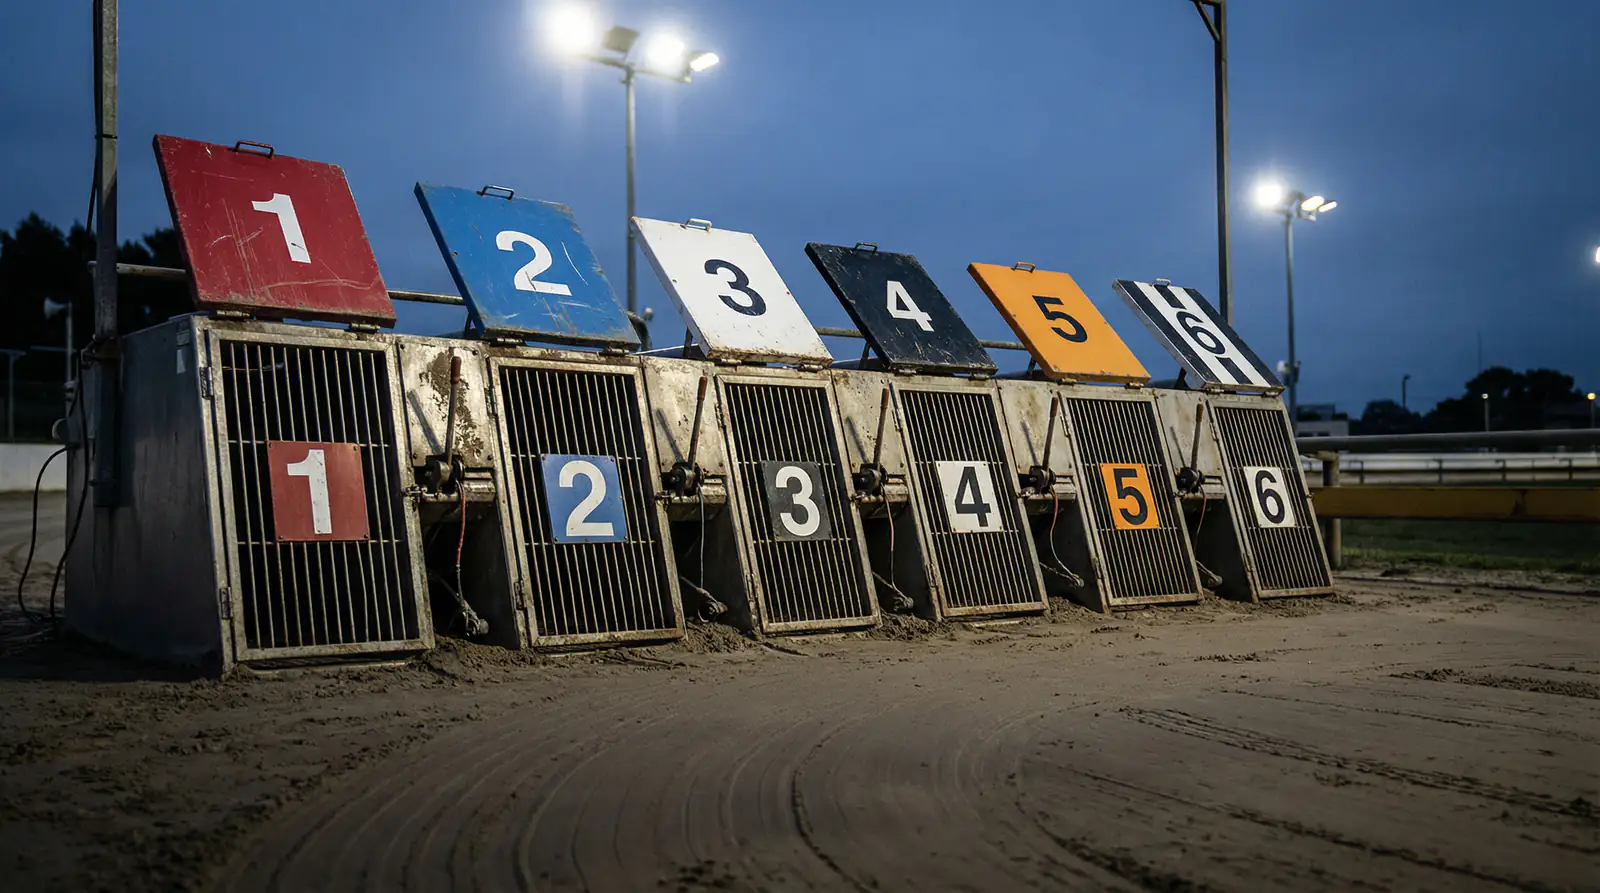
Best Greyhound Betting Sites – Bet on Greyhounds in 2026
Loading...
Trap Win Rates at Monmore: Overview
Six traps. Unequal chances. In a perfectly fair race, each trap would win roughly 16.7% of the time — one in six. But Monmore is not a theoretical construct. It’s a 419-metre oval with a Swaffham hare, a first bend 103 metres from the traps, and a sand surface that responds differently to inside and outside running lines. The result is that some traps win more than their fair share, and understanding that distribution is one of the most straightforward edges available to punters.
Across UK greyhound racing as a whole, Trap 1 — the red jacket, closest to the inside rail — tends to show a slightly elevated win rate, typically somewhere between 18% and 20% depending on the track and sample period. Monmore follows this general pattern. The inside trap benefits from the geometry of the first bend: a shorter path around the turn and less risk of being crowded wide by rivals breaking from the middle or outside boxes.
But the picture at Monmore is more nuanced than “back Trap 1 every time.” The track’s specific dimensions — particularly that 103-metre run to the first bend — create a dynamic that distributes advantage differently depending on the race distance, the grade, and the running styles of the dogs in the field. Trap 6, the widest starting position, has its own structural advantage in certain conditions: it avoids the first-bend congestion entirely, and for wide-running dogs with strong early pace, the extra ground covered on the outside can be offset by a clear, uninterrupted run into the second bend.
The other four traps — 2 through 5 — occupy the middle ground, and their win rates tend to cluster more closely around the theoretical 16.7% average. Trap 3, positioned centrally, often records the lowest win rate at tracks with short first-bend runs, because the dog in that box faces traffic from both directions without a clear rail to run to or open space on the outside. At Monmore, this effect is visible in the data, though the magnitude varies by distance and grade.
What matters for betting purposes is not the overall trap win rate in isolation, but the trap win rate filtered by the variables that apply to the specific race you’re considering. A blanket approach — always backing the inside draw, always avoiding Trap 3 — is too crude. The edge is in the detail, and the detail starts with breaking the data down by distance.
Inside Traps vs Outside Traps at 480m
Trap 1’s advantage at 480 metres isn’t magic — it’s geometry. At Monmore’s standard distance, dogs break from the traps and have 103 metres of straight running before the first bend. That’s a relatively short run-up by UK standards, and it means the field hasn’t fully separated by the time the bend arrives. The dog in Trap 1, hugging the inside rail, takes the shortest path around the turn. The dog in Trap 6, positioned widest, covers more ground to navigate the same bend. In a sport where races are decided by lengths measured in fractions of a second, that extra distance is meaningful.
Over a large sample of 480-metre races at Monmore, Trap 1 typically wins between 18% and 21% of the time. Trap 2 sits slightly lower, usually in the 17% to 19% range. The inside pair, taken together, wins around 35% to 40% of all standard-distance races — meaning more than one in three winners comes from the two boxes nearest the rail.
On the outside, Trap 5 and Trap 6 combine for a lower share, typically around 28% to 32%. Trap 6 performs better than Trap 5 in many samples because the widest box offers clear running space on the outside — the dog doesn’t need to worry about being squeezed by a rival breaking from an even wider position. Trap 5, caught between the middle runners and the wide runner, often endures the worst of both worlds.
For punters, the practical application is straightforward but not simplistic. When two dogs in the same race show similar form, similar times, and similar run styles, the trap draw becomes the tiebreaker. The dog in Trap 1 has a structural advantage at 480 metres that doesn’t depend on anything exceptional — just the geometry of the bend and the length of the run-up. All else being equal, the inside draw deserves preference. But all else is rarely equal, and a quality dog with strong early pace from Trap 5 can absolutely overcome the positional disadvantage if it has the speed to clear the field before the first bend arrives.
The error most punters make is treating trap bias as deterministic rather than probabilistic. Trap 1 doesn’t win every race. It wins a slightly higher proportion of races over a large sample. That edge is real, but it’s measured in percentage points, not certainties. A 20% win rate means the inside draw loses four out of five times. The skill is in identifying when the trap advantage aligns with form, run style, and grade to produce a selection that is genuinely more likely than the market suggests.
How Trap Bias Changes by Distance
Sprint bias doesn’t equal staying bias. The dynamics that give Trap 1 an edge over 480 metres shift meaningfully when the race distance changes, and any punter using a single trap-bias model across all distances at Monmore is working with a flawed framework.
At 264 metres — Monmore’s sprint distance — the race is over in two bends. There’s a short run from the traps to the first bend, a tight turn, a short back straight, a second bend, and a dash to the finish. At this distance, the inside traps carry an even larger advantage than they do at 480 metres, because there is almost no time for a wide-running dog to make up the ground lost on the bends. The sprint at Monmore is essentially a first-bend competition: the dog that leads at the first turn wins the majority of 264-metre races. Trap 1, with its inside position and shorter path to the bend, is structurally favoured.
Move out to 630 metres and the equation changes. Over six bends, the race lasts long enough for dogs to recover from poor early positions. A wide runner from Trap 6 that loses a couple of lengths at the first bend has five more bends and a longer overall race in which to make up the deficit. Staying races at Monmore tend to show a flatter trap distribution — the inside advantage still exists, but it’s diluted by the extra race distance. Closers, dogs that run from behind and finish strongly, gain a proportional advantage at longer distances because the race gives them more time to deploy their finishing speed.
At 835 metres and beyond, the trap draw matters less than the dog’s stamina, tactical speed, and ability to navigate traffic over multiple bends. The field tends to string out over the first two turns, and position at the halfway mark — rather than position at the first bend — becomes the stronger predictor of the outcome. Trap statistics at staying distances carry wider confidence intervals because the sample sizes are smaller (fewer staying races are programmed) and the races themselves are more tactically complex.
The practical lesson: always check trap statistics for the specific distance you’re betting on. A trap that dominates at 264 metres may be neutral at 630 metres and irrelevant at 835 metres. Monmore’s results archive, when filtered by distance, will give you a much more accurate picture of where the draw advantage lies for any given race on the card. Relying on overall trap win rates without distance filtering is one of the most common analytical shortcuts in greyhound betting, and one of the most costly.
When Trap Data Misleads: Sample Size and Context
Fifty races is a sample. Five hundred is a dataset. The difference matters because trap statistics drawn from small samples are noisy, volatile, and capable of producing patterns that look significant but aren’t.
Imagine you look at the last 40 races at 480 metres on Thursday evenings at Monmore and find that Trap 4 has won nine times — a 22.5% win rate against a theoretical baseline of 16.7%. That looks like a meaningful bias. But 40 races is a thin sample for a six-outcome event. The expected variance at that sample size means a result like nine wins from 40 could easily occur by chance alone. You’d need several hundred races to be confident that a 22.5% win rate for Trap 4 represents a genuine structural advantage rather than random fluctuation.
This is not an abstract statistical point. Punters who build strategies around small-sample trap data are exposed to a very specific kind of risk: they’re betting on a pattern that may not exist. The first 50 races suggest Trap 4 is hot. The next 200 races regress the win rate to 17%. By the time the correction is visible, the bettor has already committed real money based on the initial, misleading signal.
Context compounds the sample-size problem. Trap statistics can be skewed by individual dogs. If a strong, fast greyhound happened to be drawn in Trap 4 for three consecutive meetings — and won all three — that’s a dog-specific outcome, not a trap-specific one. Remove those three runs from the dataset and Trap 4’s win rate drops back toward the average. But the raw statistics don’t distinguish between trap advantage and dog quality. They count wins, regardless of the reason.
Grading is another confounding factor. Monmore’s racing office seeds dogs into traps based on their running style — railers toward the inside, wide runners toward the outside, middle runners in between. This means the dogs in Trap 1 are not randomly assigned; they are dogs that the racing office considers suited to an inside draw. If those dogs win more often, it might be because the trap suits them, or it might be because they were already better suited to win regardless of the trap. Disentangling these effects requires more sophisticated analysis than raw win percentages can provide.
The safest approach to trap data is to treat it as one input among several, not as a standalone strategy. Check the trap statistics for Monmore at the relevant distance and meeting type, but weight the data appropriately. A 3% edge on a sample of 500 races is more reliable than a 10% edge on a sample of 30. Combine trap draw with form, run style, trainer pattern, and going conditions. A dog with strong form, a favourable trap, and a trainer in good current form is a better selection than a dog whose only recommendation is the trap number on the racecard. Statistics illuminate. They don’t decide.