 Monmore dogs
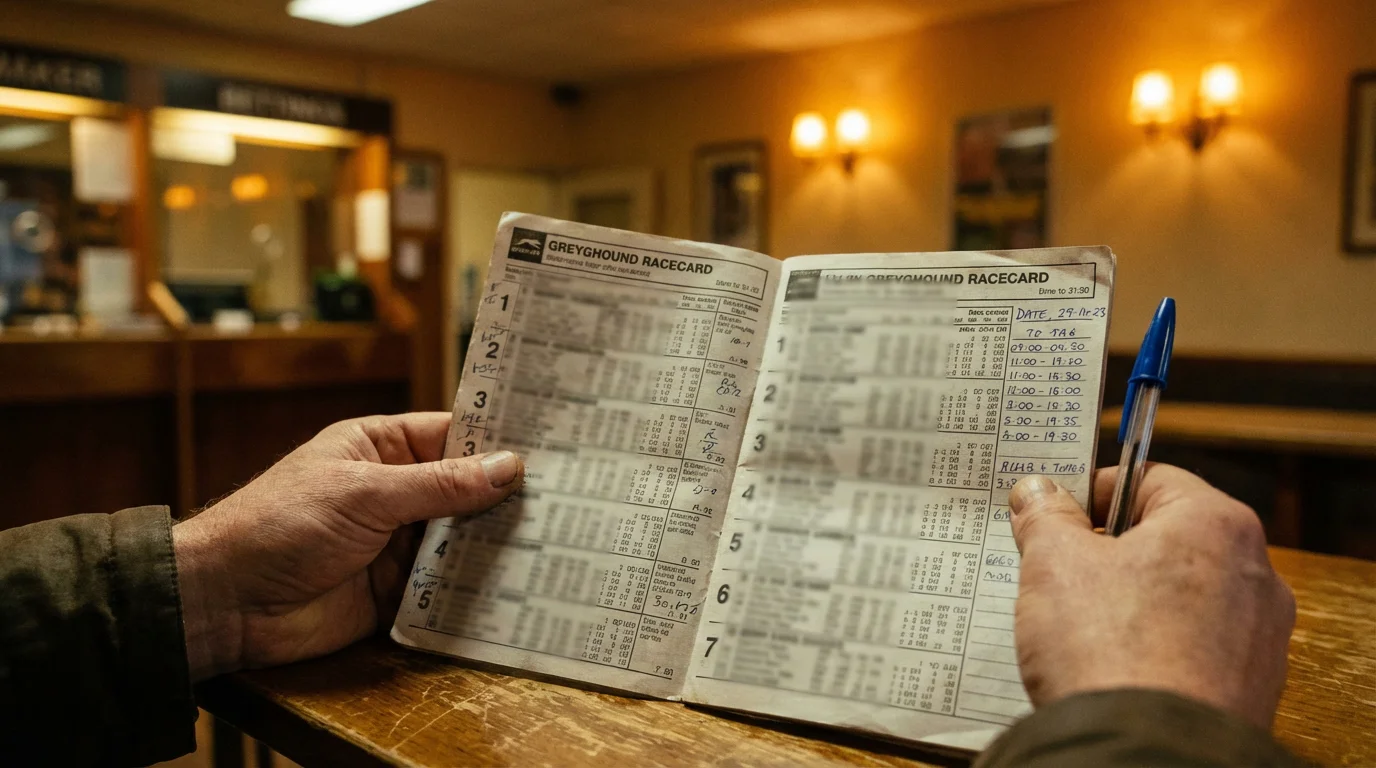
Best Greyhound Betting Sites – Bet on Greyhounds in 2026
Loading...
- The Monmore Racecard: Your Pre-Race Briefing
- Dog Profile: Name, Trainer, Weight, Age
- Trap Numbers and Colour Codes at Monmore
- Decoding Form Figures and Run Comments
- Sectional Times and Calculated Speeds
- Using Form to Compare Dogs in the Same Race
- Beyond the Racecard: Adjusted Times and Ratings
- Racecard Literacy as a Long-Term Skill
The Monmore Racecard: Your Pre-Race Briefing
A racecard is compressed intelligence — six dogs, a grid of numbers, and roughly thirty seconds of action distilled into a page you can scan in two minutes. At Monmore Green, racecards are published ahead of every meeting, whether it is a Monday afternoon BAGS fixture or a Saturday evening open-race card under the floodlights. They appear on the GBGB website, on third-party platforms like Timeform and At The Races, and in printed form at the track itself.
What a racecard contains does not change between meetings: the dog’s name, trainer, trap number, recent form, weight, sectional times, grade, distance, and starting price. What changes is how much of that information you can actually use. A casual visitor glances at the trap colours and picks a number. A serious punter reads the form sequence, cross-references the sectional splits, checks the weight trend, and then decides whether the market price reflects reality. The racecard serves both audiences, but it rewards the second one.
This guide works through every element of a Monmore racecard in the order it appears, from the dog profile at the top to the calculated times at the bottom. The aim is not to turn you into a professional analyst overnight. It is to make the racecard legible — to translate the abbreviations, explain the numbers, and show you what to look for before you look at the odds. If you already know what SP stands for, some of this will be familiar territory. If you have ever stared at a line of form figures and wondered what 3-1-5-2 actually means, this is where that stops.
Monmore publishes racecards for distances ranging from 264 metres to 835 metres, across grades from A1 down to A11. The structure is consistent regardless of distance or grade, which means that learning to read one card equips you to read every card the track produces. The specifics — what makes a good sectional time over 480 metres, what weight fluctuation should concern you, why a dog’s trap draw matters more here than at some other tracks — are Monmore-specific. The skill of reading them is universal.
Dog Profile: Name, Trainer, Weight, Age
The first line tells you who, not why. Every dog on the racecard is identified by name, linked to a GBGB registration record. Beneath the name sit the sire and dam — useful for bloodline followers, though for most practical purposes the performance data matters more than the pedigree.
The trainer’s name carries more weight than many punters realise. At Monmore, a core group of locally based trainers enter the majority of runners. These kennels know the track intimately — its surface, its trap biases, its quirks on wet evenings. A dog making its Monmore debut from a distant kennel is an unknown quantity in a way that a regular runner is not. The trainer column does not tell you who will win, but it tells you whose runners are conditioned for this specific circuit.
The dog’s colour and sex are listed as standard identification. Sex can matter indirectly: bitches in season are withdrawn from racing, and their form immediately before and after can be unreliable. If a bitch’s recent form shows a multi-week gap followed by a below-par run, the season cycle is a likely explanation.
Weight is printed in kilograms, measured on race day. This is not historical information — it is a live reading of the dog’s current condition, and it connects directly to performance in ways the betting public tends to underestimate. Age, given in months or years, provides context for everything else on the card. A greyhound’s peak typically falls between two and four years. A two-year-old improving through the grades is a different investment from a four-year-old holding its grade on experience. Both can win. The trajectory is different, and the racecard tells you where each dog sits on that arc.
What the Dog’s Weight and Age Tell You
An eighteen-month-old dropping weight is a different prospect to a four-year-old gaining it. Young dogs in the early stages of their racing career often arrive at the track slightly heavier than their eventual racing weight, and a gradual reduction over successive outings usually signals that the trainer is bringing the dog to peak fitness. If that weight drop coincides with improving times and higher finishing positions, the trend is positive. If the dog is losing weight and losing races, something else is happening — possibly overracing, illness, or a temperamental issue that conditioning has not resolved.
Older dogs gaining weight present a different question. A veteran greyhound that has crept up half a kilogram over three runs may simply be losing its racing edge, carrying more condition as its body moves away from peak fitness. Alternatively, it may have had a rest period and returned slightly heavy, with a run or two needed to strip the excess. The racecard alone does not distinguish these scenarios. But the weight figure, read alongside recent form and the gap between races, gives you enough to form a working hypothesis.
The optimal weight range for each dog is individual, and the best way to identify it is to cross-reference weight with performance across several runs. Most data platforms that carry Monmore racecards also list historical weights alongside finishing positions and times. A dog that posted its best time at 31.5 kilograms and is running tonight at 32.3 is not necessarily out of form, but the discrepancy is worth noting. Weight is not a veto. It is a filter — one more variable that either confirms or qualifies the picture the form figures are painting.
Trap Numbers and Colour Codes at Monmore
Red, blue, white, black, orange, striped — the six trap colours are standardised across every GBGB-licensed track in the United Kingdom. Trap one is red, trap two blue, trap three white, trap four black, trap five orange, trap six black and white striped. These colours are printed on the jackets the dogs wear, and they are the primary way to follow your selection once six greyhounds are moving at roughly sixty kilometres per hour.
The trap number is more than identification. It is a starting position, and at Monmore that position carries measurable consequences. Trap one sits closest to the inside rail; trap six sits widest. The run from the traps to the first bend covers 103 metres — enough for dogs to reach near-maximum speed, but not enough for a slow breaker in trap six to recover by cutting across the field.
Dogs are seeded into running style categories: railers (prefer the inside rail), middle seeds, and wide seeds. In theory, a railer draws traps one or two, a middle seed draws three or four, a wide seed draws five or six. In practice, the allocation is not always this clean, and dogs occasionally draw traps that work against their preferred running line. When that happens, form figures from previous runs in more favourable draws may overstate the dog’s chances tonight.
The seed for each dog is sometimes printed on the racecard. If absent, you can infer it from recent trap draws. A dog that has raced from traps one and two in its last four outings is almost certainly seeded as a railer. This matters when evaluating tonight’s prospects — a change of seed or an unfamiliar starting position is a note worth reading.
How Trap Position Affects Race Outcome
It is not just about being closest to the rail. Trap position at Monmore affects race outcome through a combination of geometry and traffic. The run to the first bend is long enough for dogs to reach near-maximum speed, but short enough that inside-drawn runners reach the turn before wide runners can cross over. This creates a natural funnelling effect: inside traps arrive at the bend with a clear line, while outside traps must either swing wider or check their stride to avoid crowding.
Over the standard 480-metre trip, historical data at Monmore shows that traps one and two produce a disproportionate share of winners relative to their expected baseline. In a perfectly neutral six-trap race, each position would win roughly 16.7 percent of the time. At Monmore, trap one typically outperforms that baseline by several percentage points, while trap six typically underperforms it. The effect is more pronounced in sprint races over 264 metres, where there are only two bends and almost no opportunity to recover from a wide position, and less pronounced over staying distances, where the additional bends and longer race allow class and stamina to dilute the positional advantage.
None of this means you should blindly back trap one. A slow dog in trap one is still a slow dog. What it means is that trap position is a variable with measurable weight at this track, and the racecard gives it to you for free. When two dogs look evenly matched on form and one is drawn inside, that draw is a tiebreaker — small in any single race, significant over a season of decisions.
Decoding Form Figures and Run Comments
The string of numbers after a dog’s name is its CV. A form line like 3-1-5-2-1-4 reads right to left as the most recent run first: the dog finished fourth last time out, won the time before that, finished second before that, and so on. Each number represents a finishing position in a race. This sequence is the single most consulted piece of information on the racecard, and it deserves closer attention than most punters give it.
A form sequence does not tell you how a dog ran. It tells you where it finished. The difference matters. A dog that finished third might have led until the final straight and been caught by two faster closers — a performance full of merit that the number three alone does not convey. Another dog that finished third might have been bumped at the first bend, run wide through the second turn, and stumbled home in a race it never meaningfully competed in. Both dogs carry a three in their form line. The context is entirely different.
This is where run comments — the abbreviated notes that accompany each form figure — become essential. Comments like “Led to 3” (led until the third bend), “Crd 1” (crowded at the first bend), or “SAw” (slow away from the traps) fill in the narrative that bare finishing positions strip out. Not every racecard displays run comments with equal detail, but the platforms that do — Timeform, the Racing Post, and GBGB’s own results service — are worth using specifically because they turn form figures from numbers into stories.
Reading form across a sequence of runs reveals trajectory. A line that reads 5-4-3-2 is a dog improving with every outing. A line of 1-1-3-5 is a dog going the other way. Flat form — 3-3-4-3-3 — suggests a dog that is consistent at its level but unlikely to improve without a change of circumstances: a drop in grade, a switch of distance, a favourable draw. The trajectory tells you whether the dog is rising, falling, or holding, and each state carries different implications for tonight’s race.
Form figures at Monmore should always be read with two contextual filters. First, the grade: a finishing position of second in an A2 race is a fundamentally different performance from second in an A8 race, because the quality of opposition is incomparable. Second, the track: form at Monmore itself is more directly relevant to a dog’s prospects tonight than form at Romford, Crayford, or any other venue, because track characteristics — surface, bend radius, run-up distance — vary significantly between circuits. A dog switching tracks is, to some extent, an unknown quantity regardless of what its form line says.
The form figures on the racecard are the starting point of any assessment, not the conclusion. They compress several minutes of racing — preparation, trap break, first bend, backstraight, home turn, finish — into a single digit. Your job as a racecard reader is to decompress that digit back into meaning, using the run comments, the grade, the track, and the sectional times that sit alongside it.
Finishing Positions and Grade Context
A three in A1 grade means more than a one in A6. This is the single most important principle in reading greyhound form, and it is the one most frequently ignored by casual punters who scan the form line for the lowest numbers without checking the grade column. The grading system at Monmore runs from A1 at the top down through to A11, with open races sitting above the graded ladder entirely. Each grade represents a band of ability, and the dogs within that band are theoretically matched by the racing office to produce competitive races.
When a dog wins in a lower grade, it is typically promoted — moved up one or two levels to face stronger opposition. When it loses, it may be dropped. This creates a natural cycle: a dog winning in A5 gets promoted to A4, where the opposition is stiffer, and it finishes fourth. That fourth is not a decline in performance. It is the same dog meeting better rivals. Reading form without reading grade misses this dynamic entirely and leads to assessments that confuse grade adjustments for changes in ability.
The practical application is straightforward. When comparing two dogs in the same race, check the grades in which their recent form was achieved. A dog that finished 2-3-2 in A3 races is a demonstrably better performer than one that went 1-2-1 in A7, even though the second dog’s form line looks superficially stronger. Grade context recalibrates the numbers and prevents you from overrating dogs that are merely big fish in shallow ponds.
Abbreviations: MSBK, BMP1, W, RIS and More
MSBK does not mean the dog is slow. It means “middle straight, back” — a description of where the dog was positioned during the race, not a judgement of its quality. Greyhound racecards use a dense abbreviation system to describe race incidents and running positions in minimal space, and learning this shorthand is essential to extracting meaning from the run comments.
The most common abbreviations you will encounter on Monmore racecards fall into three categories. Positional descriptions tell you where the dog raced relative to the field: “Led” (led the race), “EP” (early pace — prominent in the first third), “MsDis” (middle distance — sat in midfield), “RnOn” (ran on — finished strongly in the closing stages). These paint a picture of running style. A dog consistently described as “EP, Led” is a front-runner. One tagged “SAw, RnOn” is a closer that tends to start slowly and finish fast.
Incident descriptions flag race events that affected performance. “Crd” means crowded — the dog was impeded by another runner. “BMP” followed by a number indicates the bend at which a bump occurred: “BMP1” is a collision at the first bend, “BMP3” at the third. “W” means the dog ran wide, usually through the bends, adding distance and losing ground. “Ck” or “CkRun” means checked — the dog had to shorten stride to avoid interference. “Fell” is self-explanatory and rare but significant when it appears in recent form.
Trap-related abbreviations describe the start. “QAw” means quick away — the dog left the traps cleanly and promptly. “SAw” is slow away. “VSAw” is very slow away, a more severe version. “MsdBrk” means missed break, usually indicating the dog stumbled or hesitated as the traps opened. These matter at Monmore because a slow start puts a dog at an immediate disadvantage that may be impossible to recover from, particularly over sprint distances.
There is no need to memorise every abbreviation before you start reading racecards. The common ones — Led, EP, SAw, QAw, Crd, BMP, W, RnOn — cover the vast majority of run comments. As you read more cards, the less common abbreviations become familiar through repetition. What matters initially is understanding the system: each abbreviation is a data point about what happened during the race, and together they explain why a dog finished where it did. The form figure is the what. The abbreviation is the why.
Sectional Times and Calculated Speeds
Raw finishing time is a headline. Sectional time is the story. Every Monmore result records the total time from traps opening to the first dog crossing the line. For a standard 480-metre race, competitive times fall roughly in the 29-to-30-second range depending on grade and conditions. That headline figure tells you how fast the race was. It does not tell you how the race was run.
Sectional times break the race into segments, typically measured at the first bend. The first-bend sectional — the time from trap opening to the dog reaching the first turn — is the most analytically useful metric on the card. At Monmore, that opening 103-metre stretch captures the trap break, initial acceleration, and early positioning in a single figure. Dogs that post fast first-bend sectionals consistently are displaying genuine early pace, and early pace here is among the strongest predictors of race outcome.
The relationship between sectional times and finishing positions is not always linear. A dog with the fastest first-bend time might still lose if it expends too much energy reaching the turn and fades through the final bends. Conversely, a dog with a moderate sectional that runs a strong second half can win races despite giving ground early. The sectional data reveals these patterns. A dog whose first-bend time is consistently fast but whose finishing position deteriorates is a front-runner with a stamina limitation. One whose opening split is moderate but whose finishing time outperforms its early position is a closer with strong late speed.
Calculated speeds convert times into metres per second, allowing comparison across different distances and tracks. Several data platforms — Timeform and The Greyhound Recorder among them — publish calculated speeds alongside raw times. You do not need to perform these calculations yourself. What you need is the habit of checking the sectional column. It separates punters who are reading the race from those who are reading the result.
First-Bend Sectional: The Key Monmore Metric
103 metres to the first bend — that number shapes everything at this track. It is long enough to let genuine early pace assert itself, but short enough to punish dogs that break slowly or are drawn wide without compensating speed. The first-bend sectional at Monmore is, race for race, the most predictive single data point available on the racecard. Dogs that consistently post top-two sectionals to the first bend at Monmore win at a rate that significantly exceeds what their starting prices imply.
The practical application is to check the first-bend sectionals of every dog in the race before you look at anything else. Identify which dogs have historically reached the turn quickest, and note which trap they achieved it from. A fast sectional from trap one is expected — the geometry favours it. A fast sectional from trap five or six is more impressive because the dog has overcome a wider starting position to lead the field. That distinction matters when evaluating tonight’s draw. A dog with strong sectionals from inside traps may lose that edge if drawn outside, while a dog that posts quick times regardless of trap is displaying genuine pace rather than positional advantage.
Not every race is won at the first bend. But at Monmore, the first bend eliminates more contenders than it creates. A dog that is fourth at the turn over 480 metres needs to pass three rivals over the remaining 377 metres, all of whom are running at near-maximum speed. It happens, but less often than most punters believe. The first-bend sectional tells you who is likely to be in front when it matters most, and at Monmore, being in front at the first bend matters more often than not.
Using Form to Compare Dogs in the Same Race
The racecard gives you six dogs. Your job is to rank them. Not in the abstract, not by reputation, and not by trap colour — but by the evidence on the card, weighed against the conditions of tonight’s race. This is where racecard reading stops being a skill of comprehension and becomes a skill of judgement, and it is the step that separates someone who can read a card from someone who can use one.
Start with the grade. If all six dogs are running in the same grade and have recent form at that level, the comparison is relatively direct. Check each dog’s finishing positions over its last four to six runs. Ignore anything older unless there is a specific reason — a layoff, a kennel switch — to reach further back. Look for trajectory first: is the dog improving, declining, or holding steady? Then look at the numbers themselves: a dog averaging a finishing position of 2.5 across its last four runs is performing at a higher level than one averaging 4.0, assuming both raced in the same grade.
Next, overlay the trap draw. Identify the early-pace dogs — those with the fastest first-bend sectionals — and note their trap positions tonight. If the two fastest dogs are drawn in traps one and two, the race is likely to develop with a clear leader and a chasing pack. If they are drawn four and six, there is a chance of crowding at the first bend, which creates opportunities for dogs drawn inside who might not have the raw pace to lead in clear air but can benefit from the chaos of a contested first turn.
Weight and recent activity are the final filters. A dog returning from a three-week gap at a weight notably above its recent average is not the same proposition as one running for the third time in ten days at its established racing weight. Neither data point is disqualifying on its own, but together they adjust the picture painted by form and draw. The comparison process is cumulative: each element adds resolution until you can distinguish between the dogs with the best chance and those whose racecard profile has a flaw the market may not have priced in.
Beyond the Racecard: Adjusted Times and Ratings
Published times do not account for going, wind, or interference. A dog that ran 29.60 over 480 metres on a fast, dry surface in a clear run is not directly comparable to one that clocked 29.85 on a rain-softened track after being crowded at the first bend. The raw time says the first dog was faster. The context says the comparison is meaningless without adjustment.
Adjusted times attempt to correct for these variables. Services like Timeform apply going allowances — numerical adjustments that account for the speed of the track surface on a given night — to produce times that are theoretically comparable across different meetings. If the going allowance for a Monday evening at Monmore was plus ten (meaning the track was running ten spots slow), a dog’s raw 29.80 becomes an adjusted 29.70, reflecting what the time would have been on a standard surface. These adjustments are imperfect, but they represent a meaningful improvement over raw times for cross-meeting comparison.
Performance ratings go further. Timeform and similar providers assign each greyhound a numerical rating that synthesises its recent performances, adjusted for going, grade, track, and race circumstances. A Timeform rating of 480 represents a specific level of ability, regardless of where or when it was achieved. These ratings are particularly useful when comparing dogs that have raced at different tracks or over different distances, where raw times and form figures are hard to compare directly.
You do not need a subscription to a ratings service to bet on greyhounds at Monmore, and many successful punters rely exclusively on their own racecard analysis. But knowing that adjusted times and ratings exist — and understanding what they attempt to measure — adds a layer to your toolkit that is worth having. When a dog’s raw form looks mediocre but its adjusted time or rating suggests it ran well in difficult conditions, you have information that the casual punter staring at the bare form figures does not. That asymmetry is what creates value in a betting market.
Racecard Literacy as a Long-Term Skill
The racecard rewards repetition, not memorisation. You will not absorb every element covered in this guide in a single reading, and you will not apply them all perfectly the first time you sit down with a Monmore card. That is normal. Racecard reading is a practice, not a formula — it develops through consistent engagement with the data, one meeting at a time.
The most productive habit you can build is to study the racecard before a meeting, form your view of each race, and then watch the races — either at the track or via live stream — and compare what happened with what you expected. Where your assessment was right, note which data points led you there. Where it was wrong, check what you missed. Did the weight trend signal something you ignored? Did the trap draw matter more than you thought? Did the run comment from the last race contain a clue that the form figure obscured?
Over time, these post-race reviews build an instinct that sits on top of the analytical framework. You start to recognise patterns before you consciously process the numbers. A form line that would have meant nothing six months ago triggers a specific set of associations — grade context, trainer habit, draw implication — because you have seen similar patterns before and know what followed. This is racecard literacy. It is not knowledge of what the abbreviations mean. It is the ability to read them quickly, synthesise them accurately, and act on the synthesis before the market does.
The racecard at Monmore is the same document whether you are placing your first bet or your five thousandth. What changes is how much of it you can see. Keep reading them. The resolution improves with every card.